Produced out of an innovative collaboration between UBC students and researchers, infographics help make research more accessible.

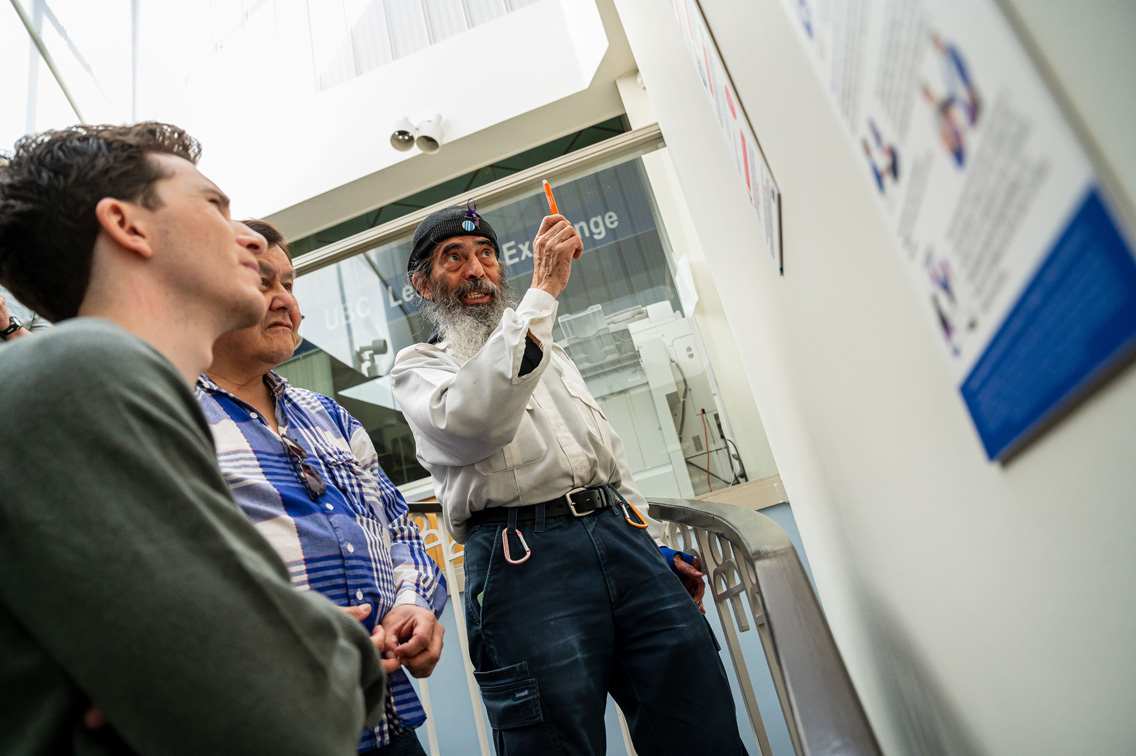
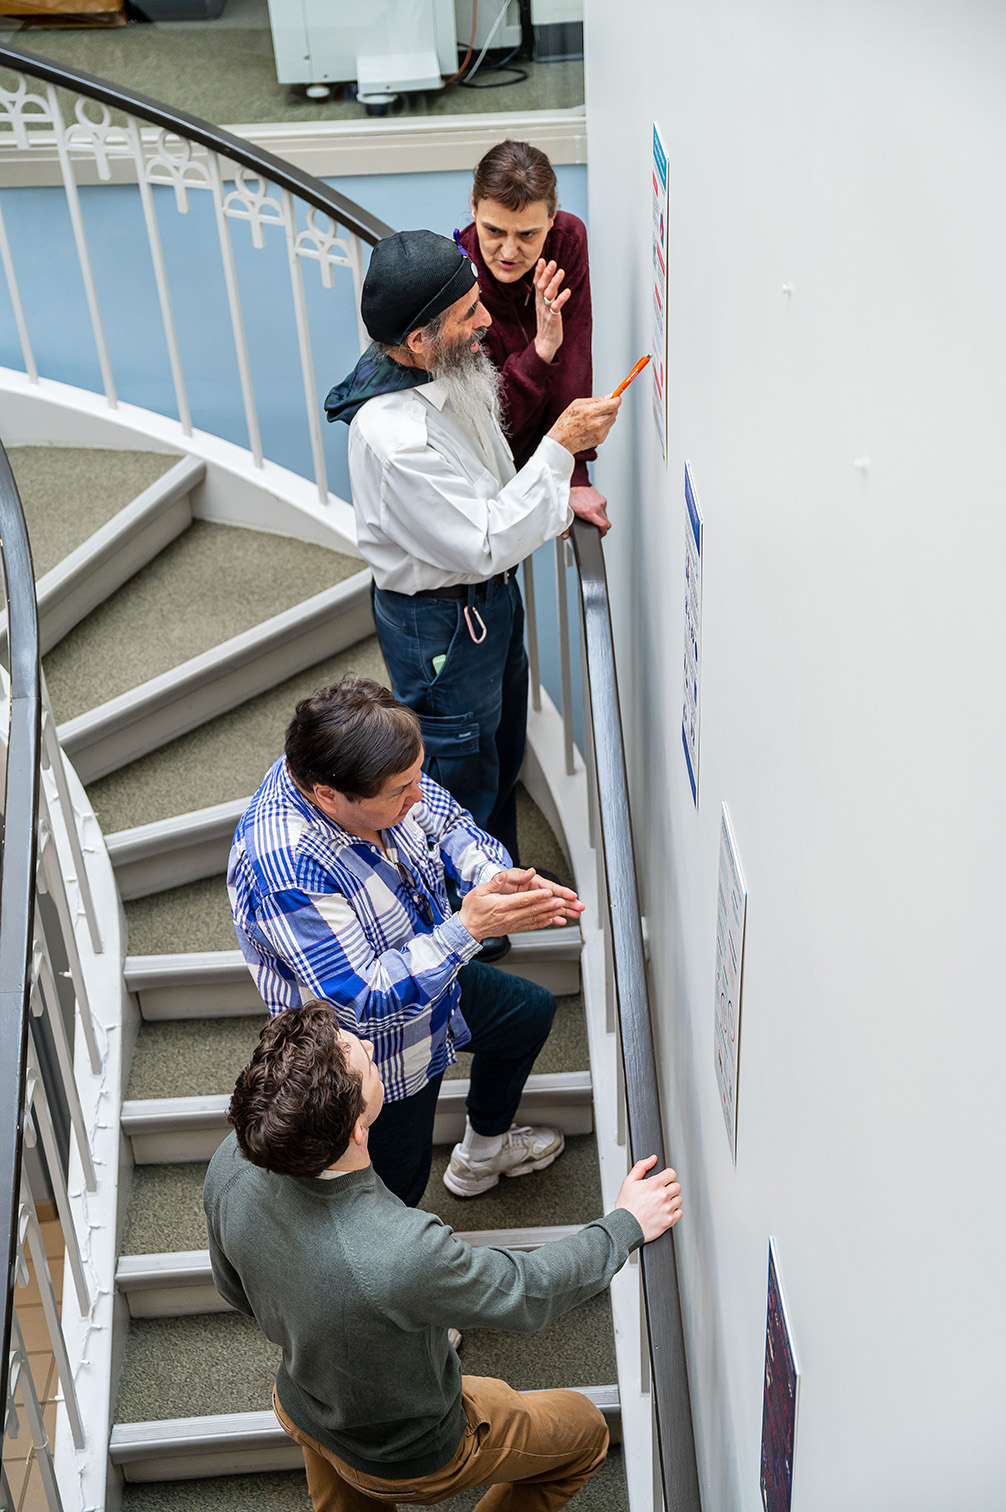
Visitors discuss infographics at the UBC Learning Exchange.
Four new student-created and researcher-vetted infographics are now available in the Downtown Eastside Research Access Portal (DTES RAP).
This year’s infographics summarize the following topics:
- How and why the Vancouver Police Department’s recent reports misrepresent mental illness and addiction as social dangers, based on work by Jade Boyd, Susan Boyd, and Thomas Kerr. View full article and infographic.
- How public spaces in the DTES like parks and alleyways are stigmatized as dangerous, but perceived quite differently by residents, based on research led by Andrew Ivsins and the Vancouver Area Network Drug Users (VANDU). View full article and infographic.
- How DTES cyclist needs are not met in an officially pro-cycling city, based on an article by Jeannette Steinmann and Brian Wilson. View full article and infographic.
- The displacement of the Black community in Hogan’s Alley and Black Strathcona in the 1970s, and the long struggle for a community land trust as redress, based on Stephanie Allen’s master’s thesis. View full article and infographic.
Created by first-year undergraduate students in the Arts Studies 100 (ASTU 100) class, which is part of the Co-ordinated Arts program at UBC, these join 19 other infographics that ASTU 100 students have created in the last three years.
“It’s a form of knowledge translation,” said Dr. Evan Mauro, who is one of the ASTU 100 instructors along with Dr. Kirby Mania. “Students take scholarly writing and summarize it in an accessible, attractive visual format. Often, they are quite literally making research more accessible by summarizing work that is behind publisher paywalls and only available to university readerships.”
The infographics are the result of a unique collaboration organized by the Making Research Accessible initiative (MRAi), a multi-disciplinary group led by the UBC Learning Exchange and the Irving K. Barber Learning Centre at UBC Library that created the Downtown Eastside Research Access Portal. As of March 2023, infographics have been downloaded more than 1,001 times via the portal.
“It’s one way we can support research to have more community impact,” Evan said, adding that researcher participation is crucial. “We’re incredibly grateful for their time and support and we hope the infographics do justice to their writing. If any other academic or community researchers are interested in having their research related to the Downtown Eastside transformed into infographics, please reach out.”

Students produce the infographics in teams, after first learning about the Downtown Eastside and the complex relationship it has with research. As part of their coursework, students visit the UBC Learning Exchange, which is in the Downtown Eastside and spend time studying the Research 101 Manifesto, a guide produced by community residents that advocates for ethical community involvement in research projects.
“As students are learning about academic writing in their ASTU 100 class,” Evan said, “we also show them models of good, community-engaged research happening locally, so that they can see positive models of research’s social role,” said Mauro.
The collaboration also works closely with student librarians in the UBC iSchool and UBC Library on a variety of projects that explore how to make research more accessible. For example, last year a student librarian, Shannon Murray, produced a toolkit with tips on turning research into infographics.
“The toolkit provides a step-by-step guide to creating an infographic – providing suggestions for language, design, and the visual elements,” Shannon wrote in a recent post. “Creating an infographic isn’t an easy process… the goal was to simplify the process and provide the guidance (and resources) that would assist anyone….”
Downtown Eastside community members and UBC Learning Exchange staff informed Shannon’s insights at in-person feedback sessions. Feedback included suggestions like limiting jargon, using visual elements that are thematically aligned with the content. Shannon noted that all participants thought infographics were an effective way to share dense academic information.
Evan also saw how the project had a real effect on students. “For students, it is an opportunity to contribute something real to stubborn social dynamics and structural inequalities that often leave them feeling powerless.”
- View all infographics in the DTES RAP.
- Download the infographic guide from the DTES RAP.
- Learn more about the MRAi here.